

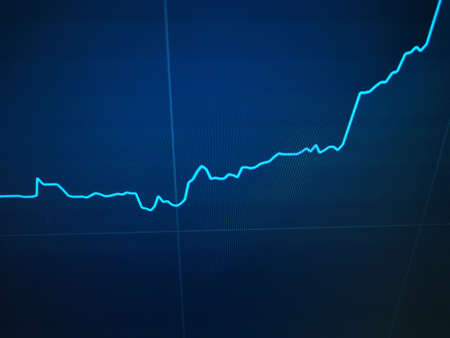
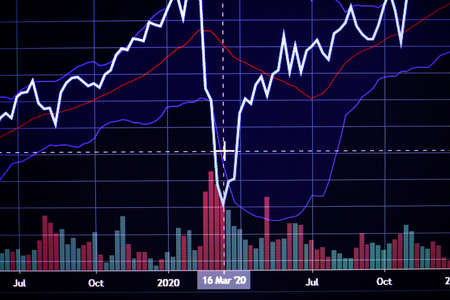
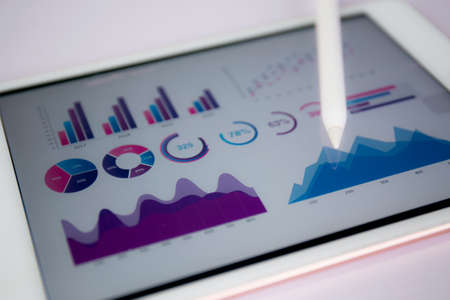
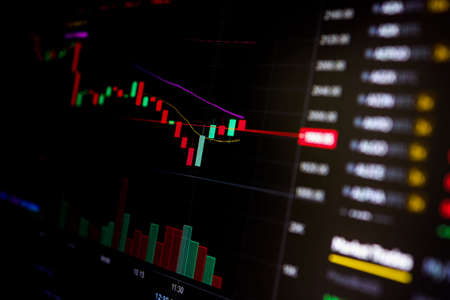
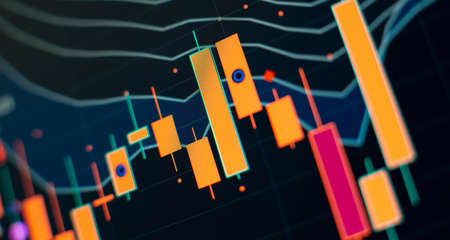
Shallow depth of field (selective focus) with details of a chart showing the stock market crash from March 2020 due to the Covid-19 pandemic on a computer screen (S&P500 index)
Коллекция по умолчанию
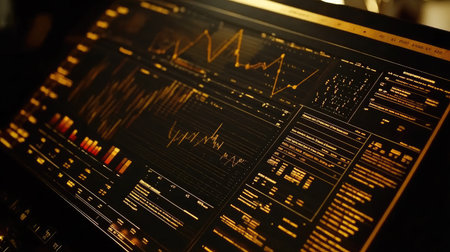
Коллекция по умолчанию
Создать новую

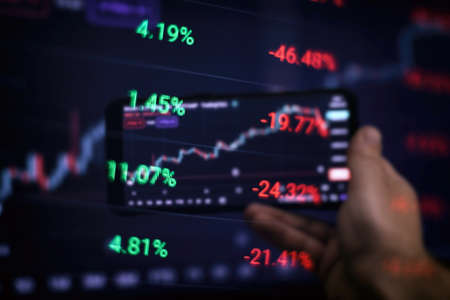
Virus pandemic covid-19 map on pc screen, global infection, internet.
Коллекция по умолчанию
Коллекция по умолчанию
Создать новую

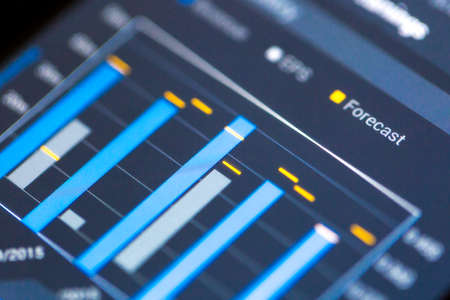
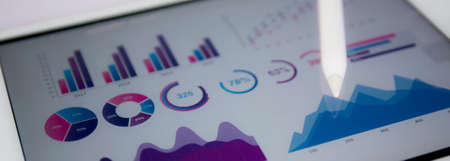
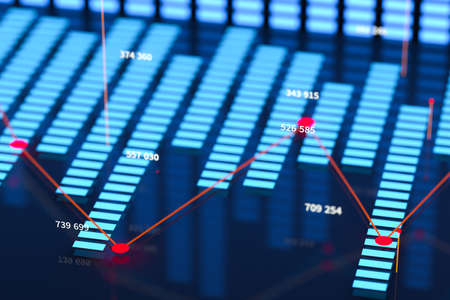
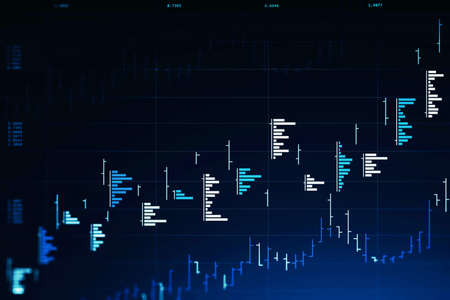
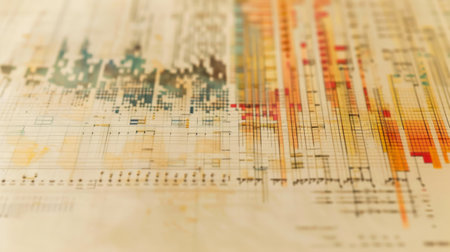
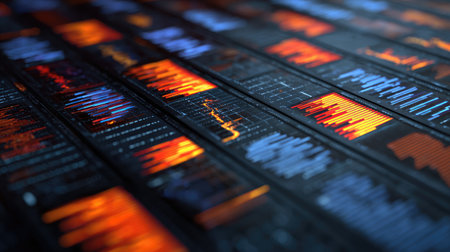
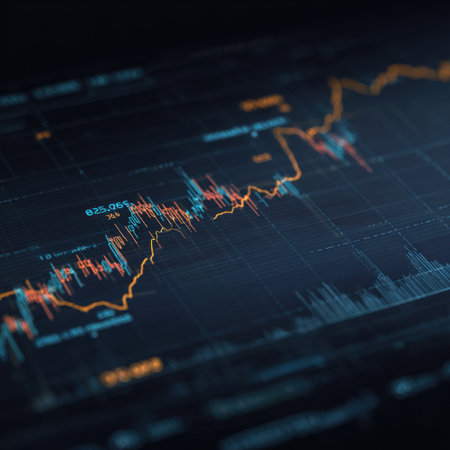
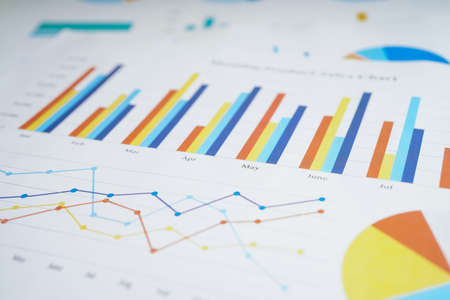
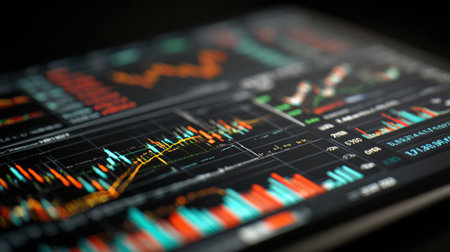
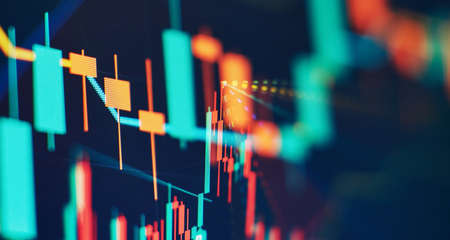
Financial instruments with various types of indicators including volume analysis for professional technical analysis
Коллекция по умолчанию
Коллекция по умолчанию
Создать новую

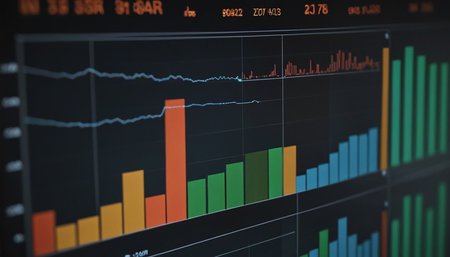
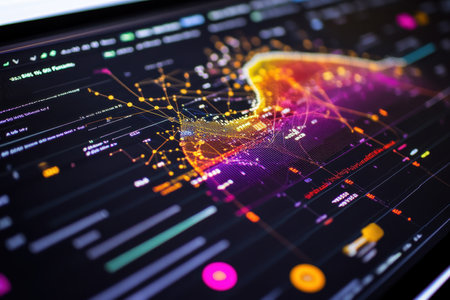
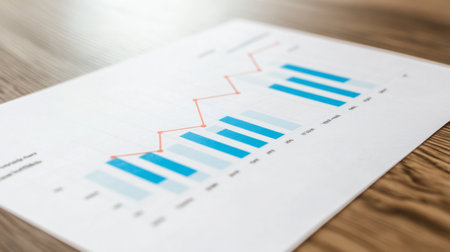
image of the financial graph on a computer monitor.
Коллекция по умолчанию
Коллекция по умолчанию
Создать новую

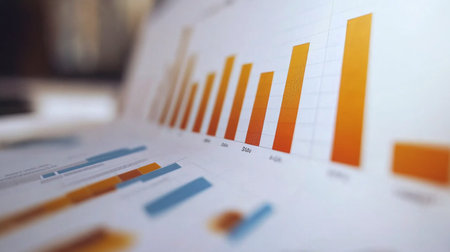
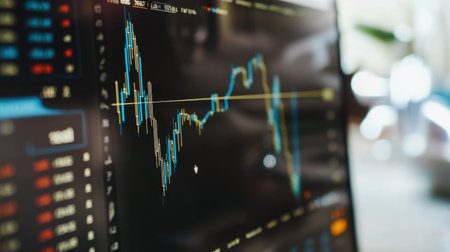
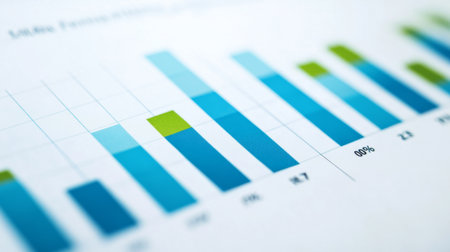
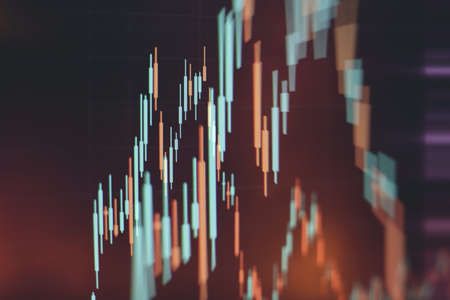
Financial stock market graph. Stock Exchange. Selective focus.
Коллекция по умолчанию
Коллекция по умолчанию
Создать новую

Financial stock market graph. Stock Exchange. Selective focus.
Коллекция по умолчанию
Коллекция по умолчанию
Создать новую
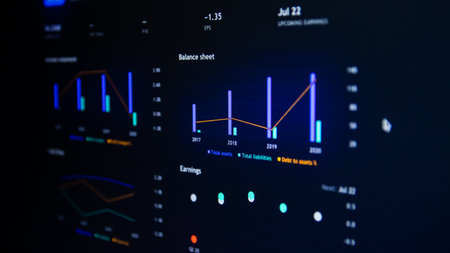
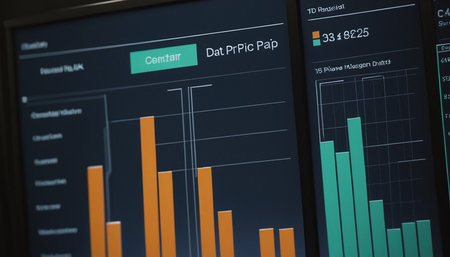
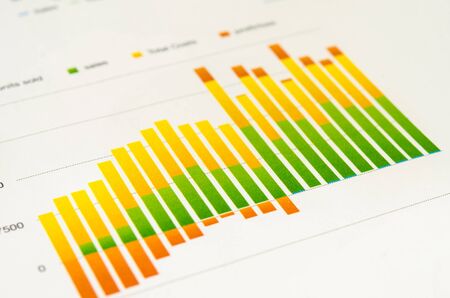
Monthly percentage bar chart showing financial comparison of 2026 budget versus actual performance data displayed on digital screen. Results tracking.
Коллекция по умолчанию
Коллекция по умолчанию
Создать новую
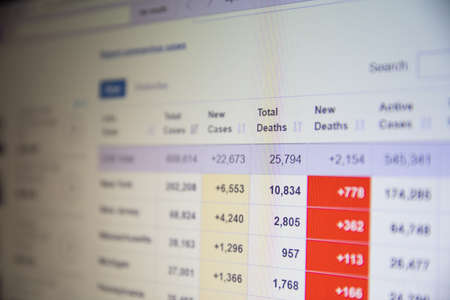
NAMPA, IDAHO - APRIL 14, 2020: Number of deaths as per worldometers website
Коллекция по умолчанию
Коллекция по умолчанию
Создать новую

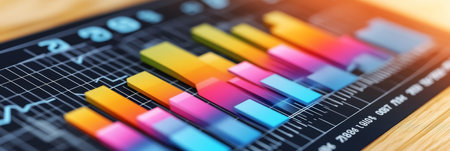
Close-up of a stock market analysis chart with a mix of bar graphs and line graphs highlighting key data
Коллекция по умолчанию
Коллекция по умолчанию
Создать новую
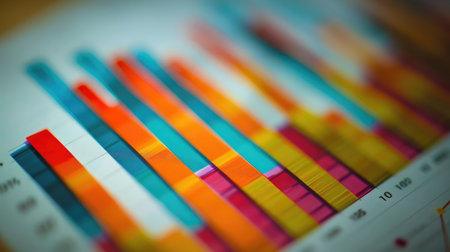
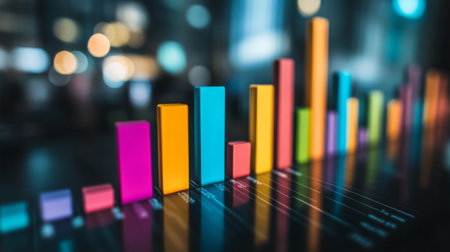
A colorful bar chart showing quarterly sales growth for a tech startup, with upward trends highlighted
Коллекция по умолчанию
Коллекция по умолчанию
Создать новую

Financial stock market graph. Stock Exchange. Selective focus.
Коллекция по умолчанию
Коллекция по умолчанию
Создать новую
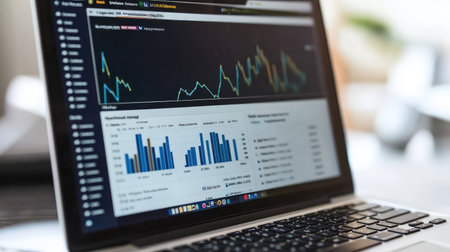
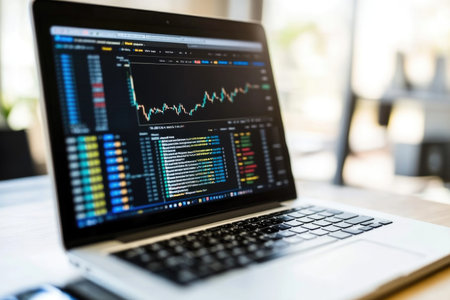
Close-up view of a laptop displaying data analysis with charts and graphs, perfect for showcasing technology, finance, or business analytics themes.
Коллекция по умолчанию
Коллекция по умолчанию
Создать новую
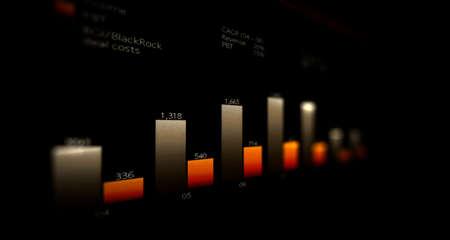
A 3D bar graph with data labels and percentage values displayed above each bar, providing a clear and informative business analysis
Коллекция по умолчанию
Коллекция по умолчанию
Создать новую

A stock market graph on a black background.
Коллекция по умолчанию
Коллекция по умолчанию
Создать новую

The business plan at the meeting and analyze financial numbers to view the performance of the company.
Коллекция по умолчанию
Коллекция по умолчанию
Создать новую

Analysis of data from graphs. select focus.
Коллекция по умолчанию
Коллекция по умолчанию
Создать новую

Stock market or forex trading graph in graphic concept suitable for financial investment or Economic trends business idea and all art work design.
Коллекция по умолчанию
Коллекция по умолчанию
Создать новую
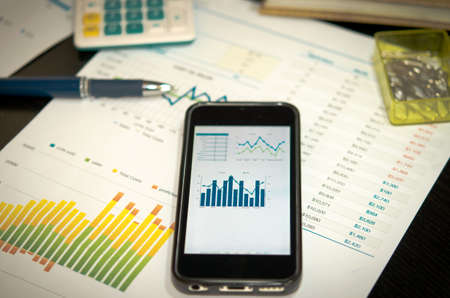
Business and trading finance contept. Stock exchange market chart view on smart phone screen.
Коллекция по умолчанию
Коллекция по умолчанию
Создать новую

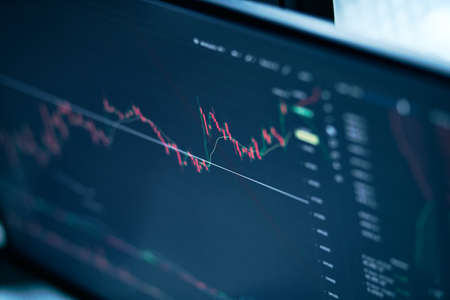
Stockmarket online trading chart candlestick on crypto currency platform. Stock exchange financial market price candles graph data pattern analysis concept. Computer screen closeup background
Коллекция по умолчанию
Коллекция по умолчанию
Создать новую
A close-up of a business report with colorful bar and line graphs.
Коллекция по умолчанию
Коллекция по умолчанию
Создать новую

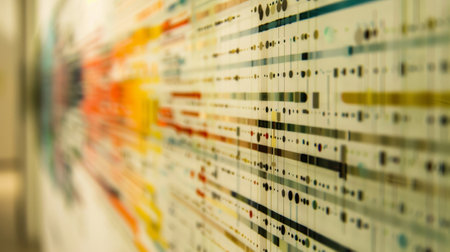
Radiated emissions spectrogram with limit lines in EMC electromagnetic compatibility test report
Коллекция по умолчанию
Коллекция по умолчанию
Создать новую

Online stock exchange application with information on screen, closeup
Коллекция по умолчанию
Коллекция по умолчанию
Создать новую

Sales profit numbers changing on monitor after global trade, real time exchange market stocks statistics growing. Financial graphs showing money trend, risk buying. Close up. Tripod shot.
Коллекция по умолчанию
Коллекция по умолчанию
Создать новую
Loading progress bar Load or download and upload circle and speed loader icon. Status or loader progress percentage bar for website or internet page in neon gradient.
Коллекция по умолчанию
Коллекция по умолчанию
Создать новую

Financial report and laptop on business desk
Коллекция по умолчанию
Коллекция по умолчанию
Создать новую

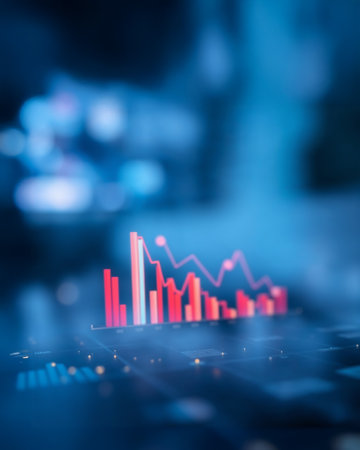
Vibrant candlestick patterns and descending trend lines illustrate a market downturn, highlighting analysis tools amid a somber financial atmosphere.
Коллекция по умолчанию
Коллекция по умолчанию
Создать новую
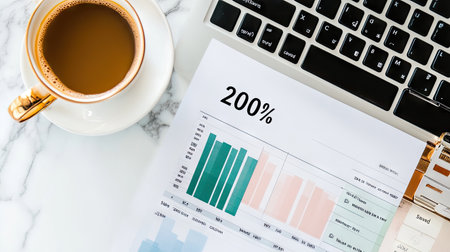
A modern workspace scene featuring a cup of coffee beside a laptop, with charts and graphs showcasing data analysis for productivity and business growth.
Коллекция по умолчанию
Коллекция по умолчанию
Создать новую
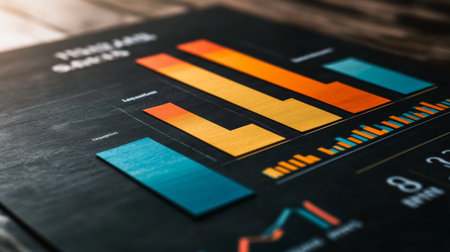
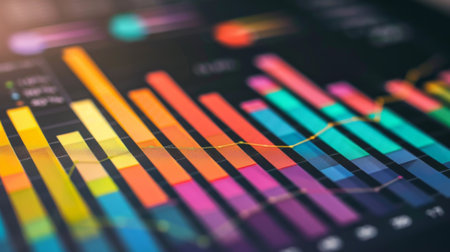
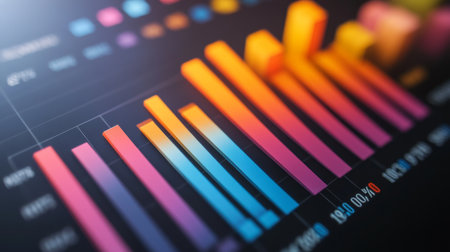
A vibrant bar chart displayed on a dark surface, showcasing data analysis and statistical trends, ideal for business presentations and reports.
Коллекция по умолчанию
Коллекция по умолчанию
Создать новую

Charts Graphs paper. Financial development, Banking Account, Statistics, Investment Analytic research data economy, Stock exchange Business office company meeting concept.
Коллекция по умолчанию
Коллекция по умолчанию
Создать новую
This abstract image features colorful bars representing data visualization, ideal for business and finance concepts, analytics presentations, and digital design projects.
Коллекция по умолчанию
Коллекция по умолчанию
Создать новую

Trader investor broker holding finger using cell phone app executing financial stock trade market trading order to buy or sell
Коллекция по умолчанию
Коллекция по умолчанию
Создать новую

Business financial or stock market background. Business graph on stock market financial exchange
Коллекция по умолчанию
Коллекция по умолчанию
Создать новую
Stock market data on monitor. Business financial graph on monitor screen. Stock market data on monitor. Business financial graph on monitor.
Коллекция по умолчанию
Коллекция по умолчанию
Создать новую

Shallow depth of field (selective focus) with details of a candlestick chart on a computer screen.
Коллекция по умолчанию
Коллекция по умолчанию
Создать новую

graph of financial growth on a computer monitor.
Коллекция по умолчанию
Коллекция по умолчанию
Создать новую
Data Analytics Concept Image with Numbers and Charts
Коллекция по умолчанию
Коллекция по умолчанию
Создать новую

Dashboard with financial analytics, futuristic visualization of business statistical graph, monitor screen in perspective, color tech background
Коллекция по умолчанию
Коллекция по умолчанию
Создать новую

Fundamental and technical analysis concept.
Коллекция по умолчанию
Коллекция по умолчанию
Создать новую

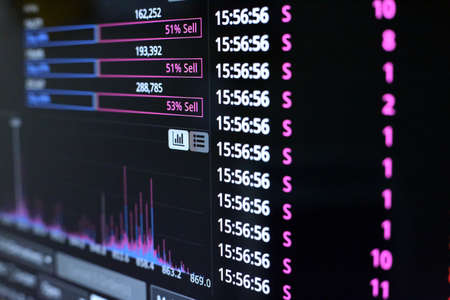
The Stock Exchange, Streaming Trade Screen, The stock screen shows a list of stocks with reduced value.
Коллекция по умолчанию
Коллекция по умолчанию
Создать новую
The dynamics of changes in currencies. Price growth chart and economic recovery
Коллекция по умолчанию
Коллекция по умолчанию
Создать новую
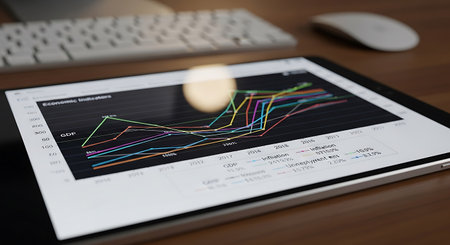
Report graph and chart of investment with finance on tablet computer on desk, datum of stock and growth, planning and statistic with economic, no people, digital marketing, business concept.
Коллекция по умолчанию
Коллекция по умолчанию
Создать новую

Businessmen miniature figure standing on investment and profit graph for analysis and discussion.
Коллекция по умолчанию
Коллекция по умолчанию
Создать новую

Stock market candlestick chart, asset prices movement, currency exchange price action simple concept. Computer screen, display, candle chart, graph detail, extreme closeup, nobody, no people
Коллекция по умолчанию
Коллекция по умолчанию
Создать новую
financial graph on the computer screen, business concept of financial data analysis
Коллекция по умолчанию
Коллекция по умолчанию
Создать новую
A close-up view of colorful charts and graphs representing business growth and analysis. Ideal for finance, marketing, and business presentations.
Коллекция по умолчанию
Коллекция по умолчанию
Создать новую
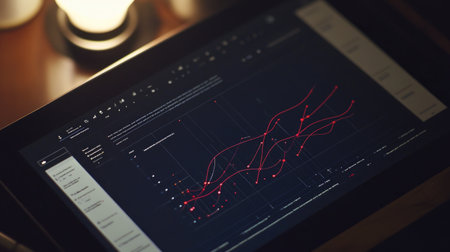
A close-up view of a digital tablet displaying an intricate data visualization. The bright lines and points create a striking contrast against the dark background.
Коллекция по умолчанию
Коллекция по умолчанию
Создать новую
Thailand Stock Exchange, Streaming Trade Screen, The stock screen shows a list of stocks with reduced value.
Коллекция по умолчанию
Коллекция по умолчанию
Создать новую
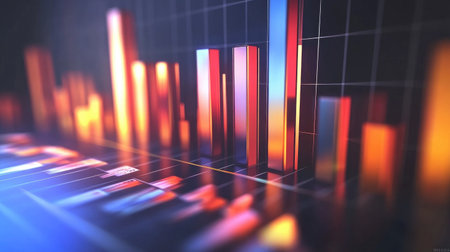
Business chart with line graph, bar chart and numbers on dark background, 3d rendering. Computer digital drawing.
Коллекция по умолчанию
Коллекция по умолчанию
Создать новую
A financial chart illustrates a notable surge in stock market profits, fueled by rising interest rates and consistent growth in money investments during recent months.
Коллекция по умолчанию
Коллекция по умолчанию
Создать новую
A close-up view of a colorful bar graph showing data analysis. This visual insight illustrates trends and performance metrics useful for business and finance.
Коллекция по умолчанию
Коллекция по умолчанию
Создать новую
Abstract colorful background showing lines and dots creating a modern design
Коллекция по умолчанию
Коллекция по умолчанию
Создать новую
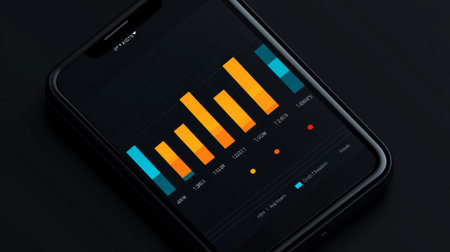
A modern smartphone showcases vibrant bar graphs and data visualizations against a dark background, perfect for illustrating business analytics and technological themes.
Коллекция по умолчанию
Коллекция по умолчанию
Создать новую
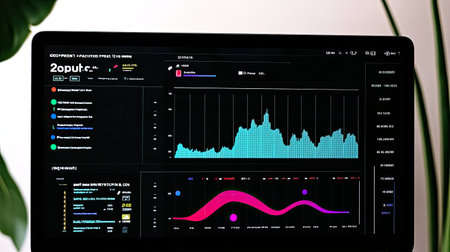
A sleek digital dashboard showcasing market analysis with engaging charts. Ideal for professionals seeking insights into financial performance and trends.
Коллекция по умолчанию
Коллекция по умолчанию
Создать новую
Business graph and trade monitor
Коллекция по умолчанию
Коллекция по умолчанию
Создать новую
Futuristic trading and graph interface over dark blue background. Concept of stock market. 3d rendering toned image double exposure
Коллекция по умолчанию
Коллекция по умолчанию
Создать новую
Colorful Financial Charts and Graphs A Bright and Abstract Representation of Market Data
Коллекция по умолчанию
Коллекция по умолчанию
Создать новую
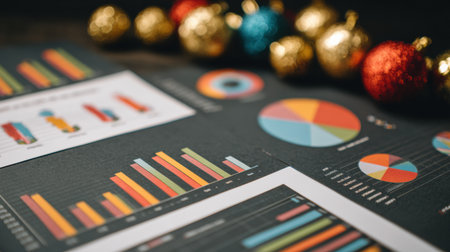
Charts and graphs display data insights on a table, while vibrant holiday ornaments add a festive touch to the workspace, creating a cheerful atmosphere.
Коллекция по умолчанию
Коллекция по умолчанию
Создать новую

indicators including volume analysis for professional technical analysis on the monitor of a computer. Fundamental and technical analysis concept.
Коллекция по умолчанию
Коллекция по умолчанию
Создать новую
Business chart with smart phone and pen
Коллекция по умолчанию
Коллекция по умолчанию
Создать новую

Business chart with line graph, bar chart and numbers on dark background, 3d rendering. Computer digital drawing.
Коллекция по умолчанию
Коллекция по умолчанию
Создать новую
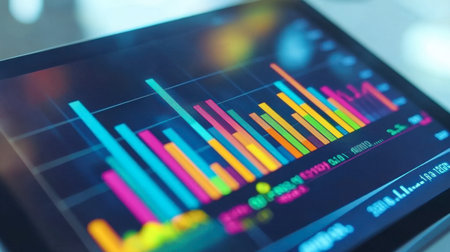
Bright and colorful data visualization displayed on a tablet screen, showcasing key statistics and trends for effective business analysis and decision-making.
Коллекция по умолчанию
Коллекция по умолчанию
Создать новую
Close-up of a sophisticated data visualization dashboard featuring various graphs and analytics for monitoring performance and trends in real-time.
Коллекция по умолчанию
Коллекция по умолчанию
Создать новую
Minimalist Financial Analysis on Laptop with Stock Market Charts.
Коллекция по умолчанию
Коллекция по умолчанию
Создать новую

Colored sticker stripes on business analytics chart closeup
Коллекция по умолчанию
Коллекция по умолчанию
Создать новую
graph of financial growth on a computer monitor. cryptocurrency.
Коллекция по умолчанию
Коллекция по умолчанию
Создать новую
A detailed bar graph plotted on graph paper, demonstrating meticulous data analysis and visualization techniques.
Коллекция по умолчанию
Коллекция по умолчанию
Создать новую
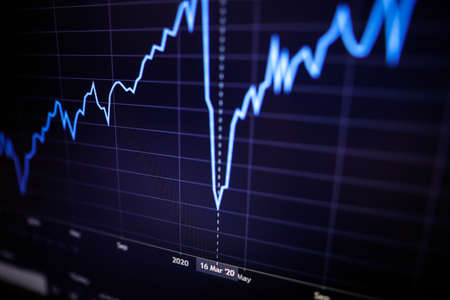
Shallow depth of field (selective focus) with details of a chart showing the stock market crash from March 2020 due to the Covid-19 pandemic on a computer screen (S&P500 index)
Коллекция по умолчанию
Коллекция по умолчанию
Создать новую
Shallow depth of field (selective focus) with details of a chart showing the stock market crash from March 2020 due to the Covid-19 pandemic on a computer screen (S&P500 index)
Коллекция по умолчанию
Коллекция по умолчанию
Создать новую
A captivating abstract visualization featuring vibrant colors to illustrate data trends and analytical patterns, emphasizing technology's role in modern analytics.
Коллекция по умолчанию
Коллекция по умолчанию
Создать новую
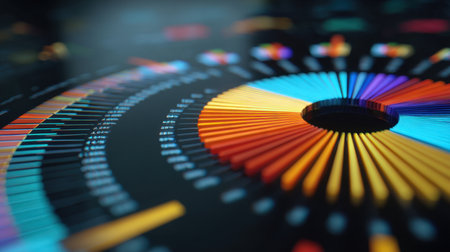
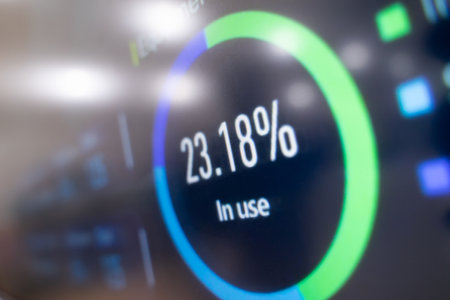
Explore a stunning digital visualization that features a colorful circular graph, showcasing data analysis through vibrant colors and innovative design, perfect for technology themes.
Коллекция по умолчанию
Коллекция по умолчанию
Создать новую
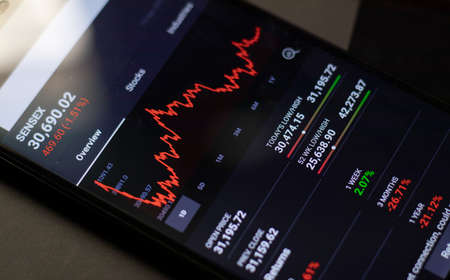
Maski, India - April 14, 2020 : Crash in sensex share market on mobile during covid-19 lockdown.
Коллекция по умолчанию
Коллекция по умолчанию
Создать новую
Financial data analyzing on monitor. Abstract financial data analysis on monitor.
Коллекция по умолчанию
Коллекция по умолчанию
Создать новую

Zoomed in on a screen showing a colorcoded timeline that visualizes shifts in consumer demand overlaid with alerts for immediate adjustments to production schedules
Коллекция по умолчанию
Коллекция по умолчанию
Создать новую
A visually striking financial graph showing stock market data and trends against a dark background, ideal for investors and analysts seeking to analyze market movements and volatility.
Коллекция по умолчанию
Коллекция по умолчанию
Создать новую

Indicators including volume analysis for professional technical analysis on the monitor of a computer. Fundamental and technical analysis concept.
Коллекция по умолчанию
Коллекция по умолчанию
Создать новую
A vibrant bar graph illustrating company earnings with colorful metrics, designed for business analysis. Perfect for presentations and financial reports.
Коллекция по умолчанию
Коллекция по умолчанию
Создать новую

Social Web Network Concept . Mixed media
Коллекция по умолчанию
Коллекция по умолчанию
Создать новую

A visually engaging workspace featuring colorful push pins and sticky notes on graph paper, illustrating data representation and enhancing creative organization for projects.
Коллекция по умолчанию
Коллекция по умолчанию
Создать новую
Close-up of digital tablet with financial chart on screen. Business concept
Коллекция по умолчанию
Коллекция по умолчанию
Создать новую

Notebook work with statistics on the table
Коллекция по умолчанию
Коллекция по умолчанию
Создать новую

Team work with results and reports
Коллекция по умолчанию
Коллекция по умолчанию
Создать новую
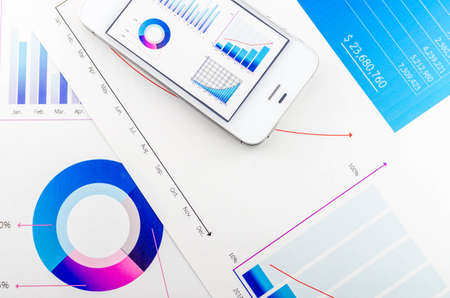
Graphs and phone
Коллекция по умолчанию
Коллекция по умолчанию
Создать новую

A detailed close-up view of a candlestick chart displaying stock data. The graphic illustrates financial trends with vibrant colors, aiding data analysis.
Коллекция по умолчанию
Коллекция по умолчанию
Создать новую
Report graph and chart of investment with finance on tablet computer on desk, datum of stock and growth, planning and statistic with economic, no people, digital marketing, business concept.
Коллекция по умолчанию
Коллекция по умолчанию
Создать новую

Business and Economy Theme. Trading Cryptocurrencies. Stock Market Candles Chart on Computer Display Close Up.
Коллекция по умолчанию
Коллекция по умолчанию
Создать новую
Charts Graphs paper. Financial development, Banking Account, Statistics, Investment Analytic research data economy, Stock exchange Business office company meeting concept.
Коллекция по умолчанию
Коллекция по умолчанию
Создать новую
A detailed display of advanced data analytics showcasing colorful lines and nodes interconnected on a dark background, highlighting trends and relationships in information.
Коллекция по умолчанию
Коллекция по умолчанию
Создать новую

business graph with pen
Коллекция по умолчанию
Коллекция по умолчанию
Создать новую
Business success and growth concept. Stock market business graph chart on digital screen. Forex market, Gold market and Crude oil market.
Коллекция по умолчанию
Коллекция по умолчанию
Создать новую
Stock exchange, cryptocurrency price chart on a screen. Candlestick chart, btc. Online currency exchange market. Trading, bidding. Tracking the cryptocurrency rate. 4K. Close up.
Коллекция по умолчанию
Коллекция по умолчанию
Создать новую
Working set for analyzing financial statistics and analyzing a market data. Data analysis from charts and graphs
Коллекция по умолчанию
Коллекция по умолчанию
Создать новую

ballpoint pen indicates income graphs lying on the table
Коллекция по умолчанию
Коллекция по умолчанию
Создать новую

Analysis business accounting on info sheets. Businessman hand working on analyzing investment charts for Gold market, Forex market and Trading market.
Коллекция по умолчанию
Коллекция по умолчанию
Создать новую
Intricate trading analytics display lively graphs and charts reflecting trading activity and stock price movements during market hours.
Коллекция по умолчанию
Коллекция по умолчанию
Создать новую
A business growth chart displayed on a wooden table represents data analysis and strategic planning. Ideal for finance and marketing themes.
Коллекция по умолчанию
Коллекция по умолчанию
Создать новую
Analyzing financial statistics and analyzing a market data. Data analysis from charts and graphs
Коллекция по умолчанию
Коллекция по умолчанию
Создать новую
analyzing investment charts on table.
Коллекция по умолчанию
Коллекция по умолчанию
Создать новую
Volume analysis for professional technical analysis on the monitor of a computer. Fundamental and technical analysis concept.
Коллекция по умолчанию
Коллекция по умолчанию
Создать новую
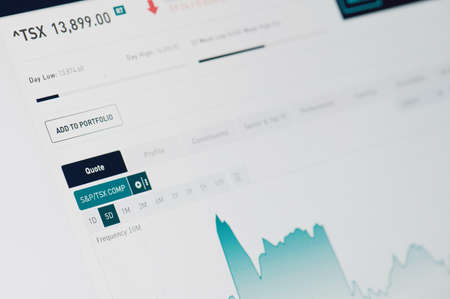
New-York , USA - April 17 , 2020: Graph in Toronto Stock Exchange close up view on computer screen
Коллекция по умолчанию
Коллекция по умолчанию
Создать новую
Abstract image of financial data and stock market analysis with colorful graphs and charts, representing economic trends and market fluctuations.
Коллекция по умолчанию
Коллекция по умолчанию
Создать новую
Legion-Media
Создайте свои проекты на основе качественных стоковых фотографий и видео.


Copyright © Legion-Media.